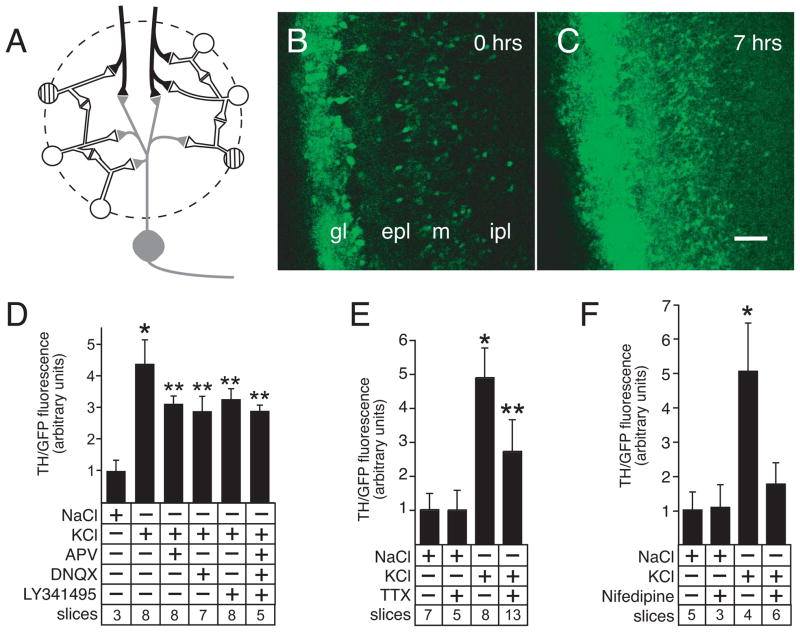
Figure 2.
Induction of ThGFP expression in forebrain slice cultures. A, diagram of the synaptic connections in a typical glomerulus. Olfactory receptor neuron axon terminals (black) form axo-dendro-dendritic synapses with mitral/tufted projection neurons (gray) and PG interneurons (white and striped). PG interneurons also make dendro-dendritic connections with both mitral/tufted cells and other PG interneurons. Dopaminergic interneurons expressing TH (striped cells) are only a subset of the total PG interneuron population. B and C, focal stimulation of the olfactory receptor nerve layer in forebrain slice cultures at 0 and 7 hours, respectively. Consistent with expression patterns observed both in vivo and in depolarized slice cultures, focal stimulation induced ThGFP expression in the periglomerular cells within the glomerular layer (gl) as well as in granule cells located in the external plexiform (epl) and mitral cell (m) layers. By contrast, expression is minimal in the internal plexiform layer (ipl). These findings confirm functionality of both the axon terminals in the forebrain slice cultures and the synaptic connections that are necessary for activity-dependent expression of TH. This induction of ThGFP by focal stimulation of olfactory receptor axon terminals confirms integrity of glomerular layer microcircuits in forebrain slice cultures. Bar = 50 μm. D, ThGFP expression induced by depolarization is partially blocked by treatment with antagonists to glutamatergic receptors (NMDA receptor, AMPA receptor and metabotropic receptor are blocked with APV, DNQX and LY341495, respectively), either individually or in combination. E, treatment with TTX (a sodium channel blocker) also partially reduces ThGFP expression induced by depolarization. F, treatment with the L-type Ca+2 channel blocker, nifedipine, prevents induction of ThGFP expression above baseline levels (control NaCl-treated). Data are expressed as mean ± standard deviation. Single asterisk indicates values that are significantly greater than cultures treated with NaCl. Double asterisk indicate values significantly greater than NaCl treated cultures, but significantly less than cultures treated with only KCl. For the graphs shown in D – F, “slices” indicates the number of cultured slices used to calculate the mean and standard deviation shown for condition tested.

