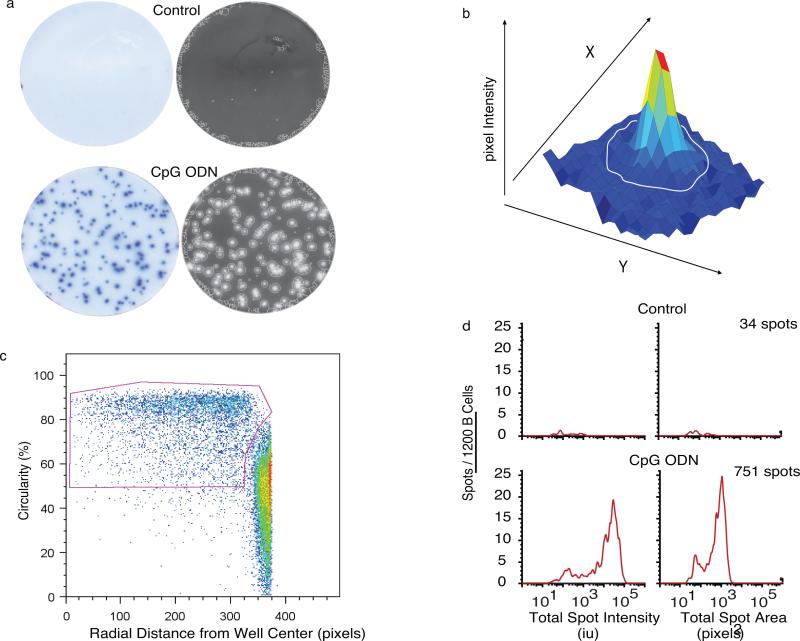
Figure 2. Bimodal Distribution of the IgG ELISPOTs in CpG+CK-stimulated memory B cells.
Unstimulated and CpG+CK-stimulated human IgG depleted CD27+ memory B cells, were incubated in ELISPOT plates for 6 hours. (a) Raw and EXPLORAspot-processed representative ELISPOT well images selected from 9 independent experiments (3-6 replicate wells per experiment) show that CpG+CK-stimulation increased the amount of IgG secreted as well as the number of cells secreting IgG (p<0.001). The EXPLORAspot software detected the circled spots. To eliminate well-edge artifacts, all spots data from each 96 well plate were pooled and FACS analysis software used to create a bivariate plot of the radial distance of each spot from the center of the well versus spot circularity. (b) A three-dimensional plot showing x and y coordinates used for spot area calculation. Spot intensity is the sum of spot pixel values (defined in arbitrary intensity units: Int-U) which are represented here by the z-axis. (c) Gating strategy that maximized retention of circular “true” spots at well edges, while eliminating less circular well edge artifact. (d) Histograms of pooled spot populations from 6 replicate wells including the wells pictured in 2a showing that spot numbers increased 20-fold in response to CpG+CK stimulation. Spot total intensity values also increase with some heterogeneity in IgG spot sizes over the population.

