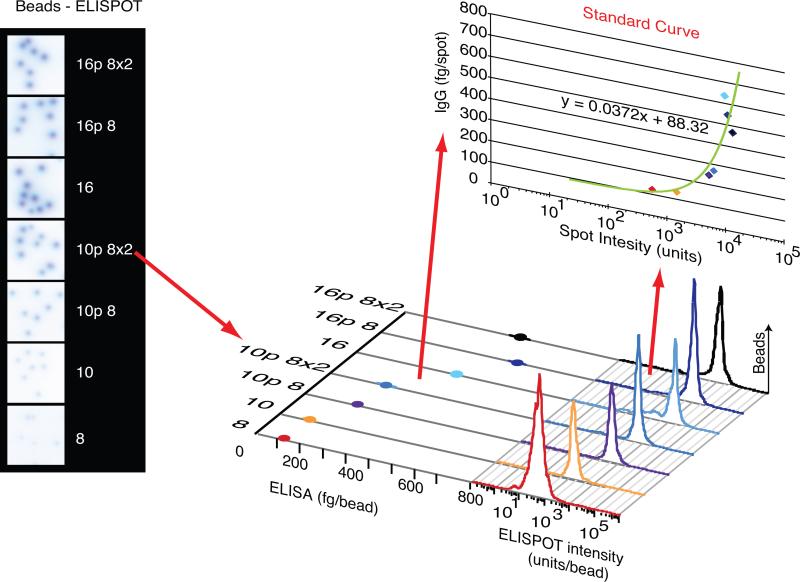
Figure 3. Bead-mediated Estimation of IgG Release.
Sampled well images with spots produced by human IgG released from different sizes of polymer beads. Spot size and ELISA data quantitating IgG release from the same bead samples were plotted to construct a standard curve describing the mathematical relationship between spot size and IgG released per bead. This standard curve could then be used to assign absolute IgG secretion rates to individual spots in the experiment.

