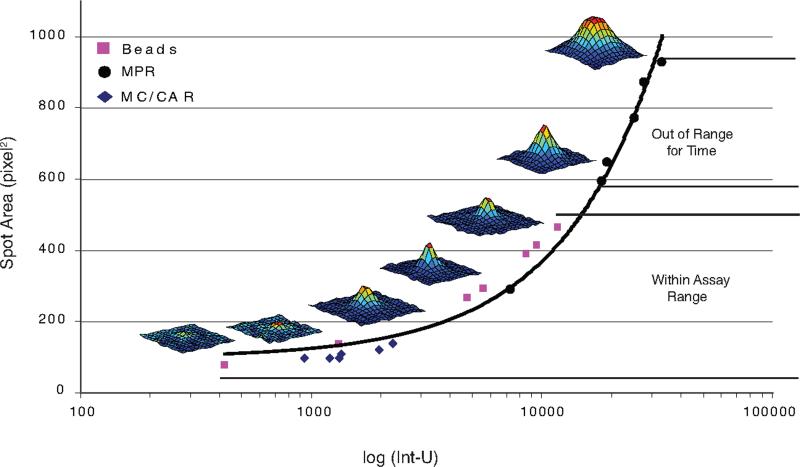
Figure 4. The mathematical relationship between the spot area and total intensity.
The means of the areas and total spot intensity values of spots generated by low-rate (MC/CAR) and high-rate (MPR1130) IgG-secreting control myeloma cells lines as well as IgG-releasing beads were compared. A direct relationship between spot area and total intensity can be seen, whether the spot was formed by cells or by beads. Therefore, either parameter could be used for comparison to IgG released by ELISA. Three-dimensional well images indicating changes in spot morphology with increasing spot size are also shown.

