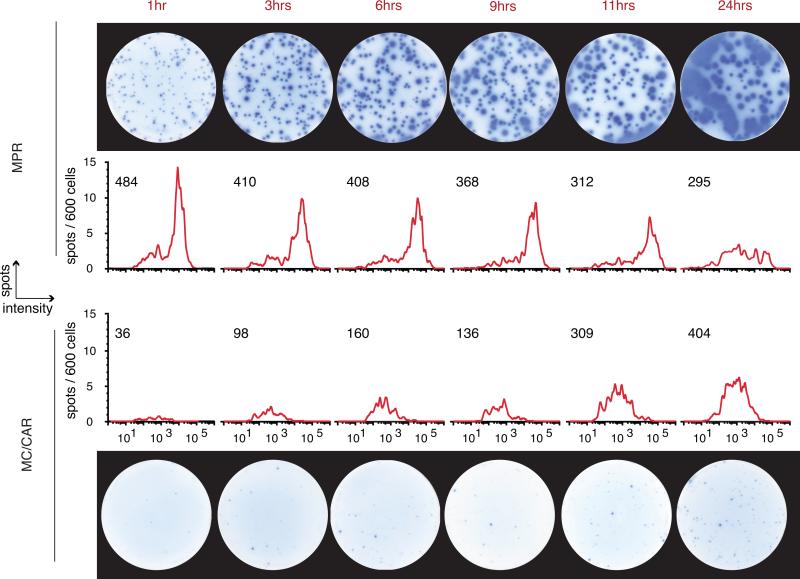
Figure 5. Spot Development Over Time of Incubation (tinc).
A time course showing well images and matching spot intensity histograms of two myeloma cell lines secreting IgG at a high and a low rate. At time points beyond 6 hours, spots detected from the high-rate secreting cell line MPR spot begin to merge and then cannot be accurately analyzed. Beyond 12 hours, the low-secreting myeloma cells are still producing spots that are coming into detectable range of sizes, so time is a critical factor in these studies. The effective range of total spot intensity values detected was 30 to 2×10⁵ INT-U.

