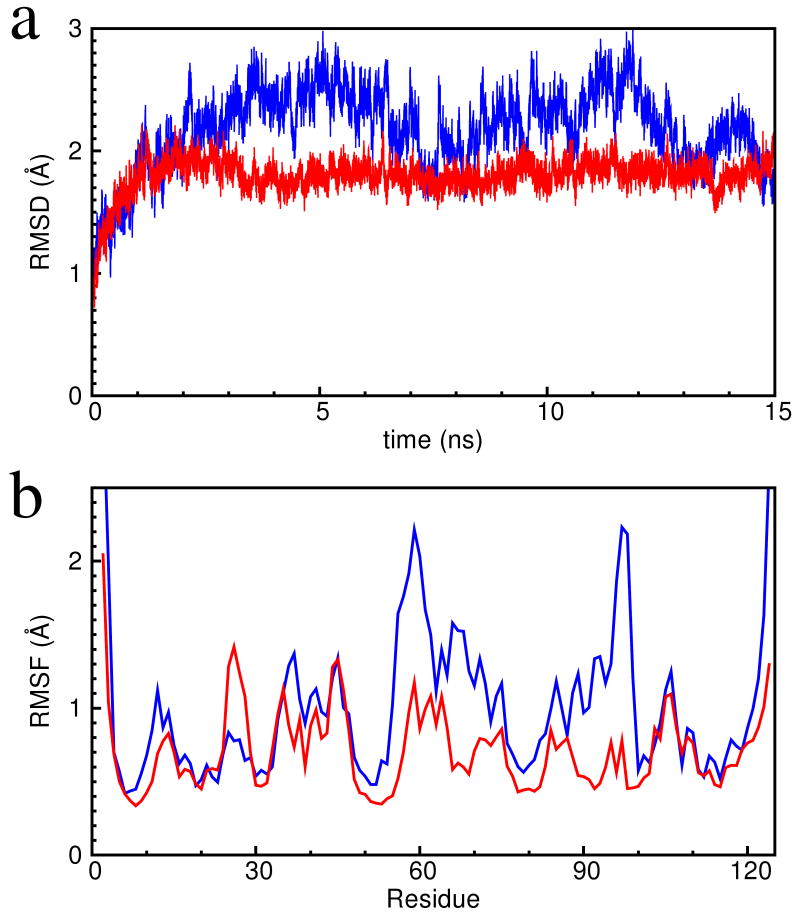
Figure 2.
(a) The time traces of the backbone root mean square deviation (RMSD) from the refined NMR structures for the trajectories: inactive in blue and active in red. (b) The backbone root mean square fluctuation (RMSF) of the simulation trajectories using the refined inactive (blue) and the refined active (red) conformations. The 3ns to 15ns segments of the 15ns simulation trajectories are used in the computation of RMSF.

