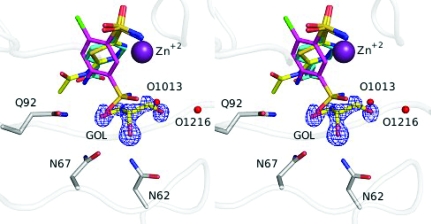
Figure 2.
Stereo image of a superposition of inhibitors and glycerol for 3hs4 (ligand C atoms in yellow, protein C atoms in gray; this work), 2pov (C atoms in magenta; Alterio et al., 2007 ▶) and 2nno (C atoms in cyan; Srivastava et al., 2007 ▶). The 2|F o| − |F c| electron-density map (blue) of glycerol (GOL) is contoured at 2.0σ. N atoms are coloured blue, O atoms red, S atoms orange, Cl atoms green and Zn atoms purple. Waters are represented by red spheres. This figure was created using PyMOL (DeLano, 2002 ▶).

