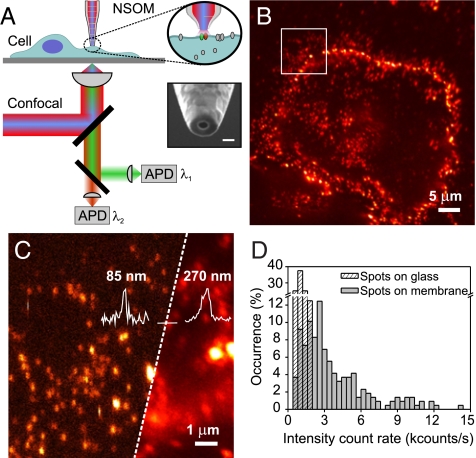
Fig. 1.
LFA-1 forms nanoclusters on monocytes before ligand binding. (A) Principle of operation: the sample is imaged either by confocal or NSOM. In NSOM, the probe raster scans the sample laterally while locally exciting fluorophores exclusively on the cell membrane. The inset shows a representative NSOM probe as used in our experiments. (Scale bar, 100 nm.) (B) Confocal image of LFA-1 at the cell surface using mAb TS2/4-Alexa647. (C) Composed confocal (Right) and NSOM in aqueous conditions (Left) image of the region highlighted in B. The increased spatial resolution of NSOM (85 nm) compared to confocal (270 nm) is further emphasized by the line profiles over the same individual spot. (D) Intensity count rate distribution of LFA-1 nanoclusters (220 spots) (gray) over multiple cells and of individual Abs. non-specifically attached to the glass surface (dashed).

