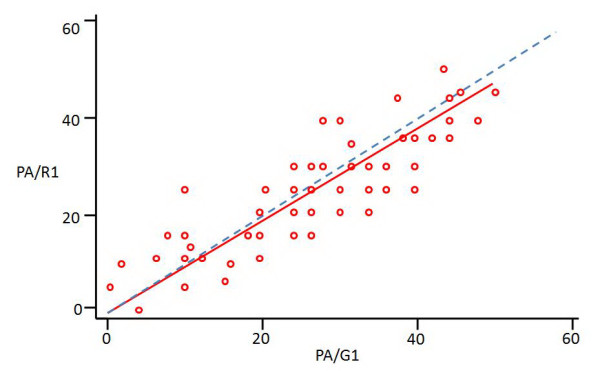
Figure 11.

An example of graphical representation of correlation between visual estimation of popliteal angle (PA) given by the resident (R) and goniometric measurement (G) at the first part of study (1), according to the test of Lin. Small red circles: pairs of observation; Red line: best-fit line of observations; Dashed blue line: 45 degrees line; measurements are in degrees.
