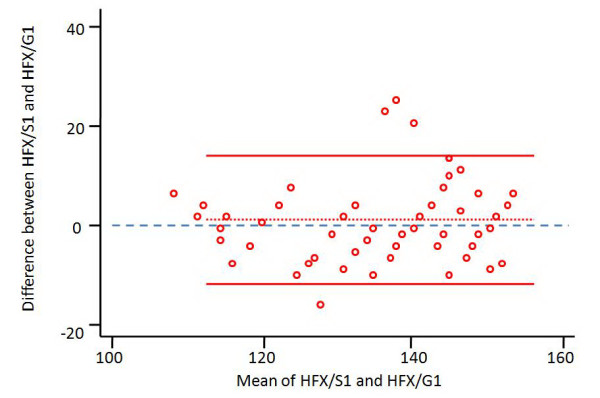
Figure 12.

A representation of Bland-Altman Graph for hip flexion (HFX) estimated by the specialist (S) and compared to goniometric measurements (G) in the first part of the study (1). Small red circles: representations for couples of observation with mean value of measurements as "x" and their difference as "y"; Dotted red line: mean measurement error; Solid red lines: limits of agreement at 95%; Blue dashed line: zero line; measurements are in degrees.
