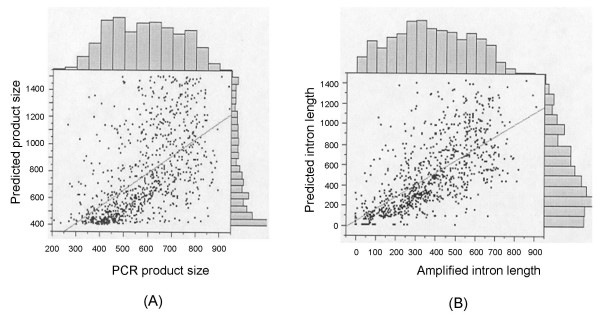
Figure 5.
Comparison between the total amplicon sequence sizes (bp) in wheat and the predicted PCR product sizes on the basis of rice genome sequence (A), and comparison between the amplicon intron length (bp) and the predicted intron length (bp) (B) based on alignments of wheat ESTs to the rice genome. A total of 888 data points from 145 homologous group 1 primer pairs and their amplicons and genomic sequences were used to draw scatter plots and histograms using the JMP 7.0 software (SAS Institute Inc.). A significant regression line was fit between the total amplicon sequence sizes in wheat and the predicted PCR product sizes (A) as well as between the amplicon intron lengths and the predicted intron lengths (B). The amplified intron lengths were determined using BLAST searches of amplified genomic sequences against their corresponding ESTs.

