Figure 5.
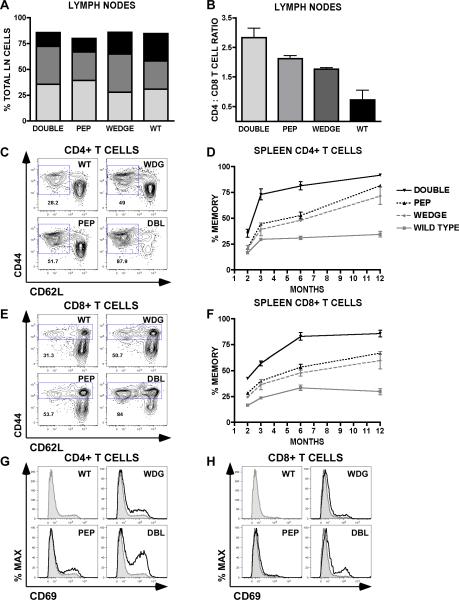
T cell activation and differentiation in CD45w/w/Pep−/− double mutant mice. (A) Lymph node composition at 6 months of age was determined by staining single cell suspensions with CD4 (dark gray), CD8 (black), and CD19 (light gray) mAb. (B) CD4 T cell / CD8 T cell ratios calculated from lymph node specimens at 6 months of age. Values are the mean of three biological replicates +/− SEM. (C) and (E) Representative cytometry plots of splenic CD4 and CD8 T cells stained with antibodies to CD62L and CD44 at 6 months of age. Gated fractions represent memory /effector cells. (D) and (F) Gated splenic T cell memory fractions depicted in (C) and (E) are plotted over time in (D) and (F) respectively. (G) and (H) Representative histograms of splenic CD4 T cells (G) and CD8 T cells (H) stained with CD69 to detect activation status. Shaded histogram represents wild type for comparison. Animals were assessed at age 6 months. Data in all panels (A)–(G) are representative of at least 3 independent experiments performed at varying time points each involving 3 animals/genotype.

