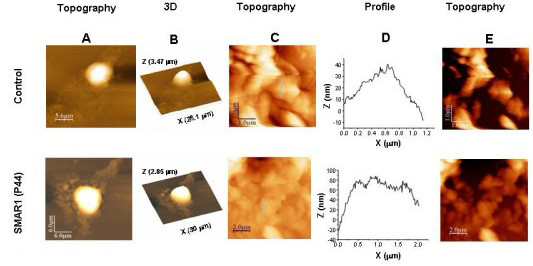
Figure 5.

SMAR1 overexpression results into increased cytoskeletal volume. AFM images of cellular cytoskeleton of HEK 293 control cells as well as those treated with SMAR1-P44 peptide. Height images of a group of cells (A) and a single cell (B) are shown whose 3D (C) is also depicted. Height (D) and profile (E) images of a zoomed area within the single cell are shown in both control and SMAR1-P44 treated cells. Using flooding/find hills option of free software WSxM (to calculate the volume of the cellular cytoskeleton), the zoomed image showing the volume of cytoskeleton (F) is more in SMAR1-P44 treated cells than the control cells.
