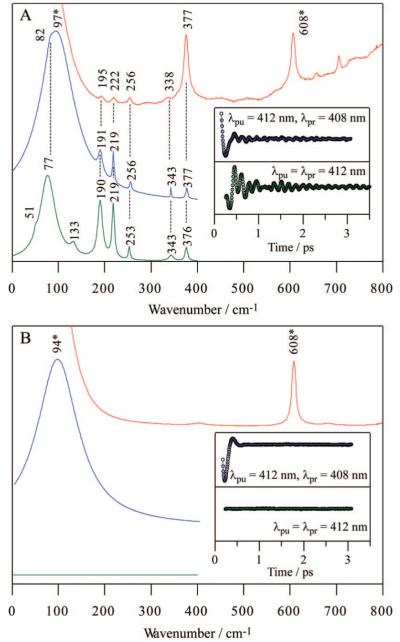
Figure 2.
Correlations between Raman and coherence spectra for (A) Fe(P)(Cl) in benzene and (B) benzene only. Raman spectrum (red) was measured with excitation at 413.1 nm, whereas open band (green) and detuned (blue) coherence spectra were measured at a carrier wavelength of 412 nm. The detuned coherence data were collected with a 0.5 nm spectral window, detuned 4 nm to the blue of the carrier wavelength. The inset shows time-domain oscillation data (circles) and LPSVD fits (lines) corresponding to an open band detection (green) and to a detuned detection (blue) scheme. Asterisks indicate benzene bands. Note that the open band experiments show no trace of the benzene bands as expected theoretically for a transparent fluid.

