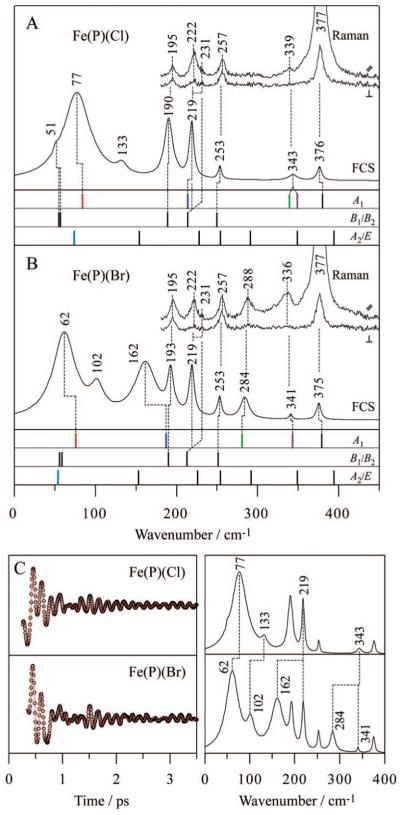
Figure 3.
Comparison of experimental spectra and calculated frequencies for (A) Fe(P)(Cl) and (B) Fe(P)(Br). Polarized Raman spectra were measured with excitation at 413.1 nm, whereas open band coherence spectra were measured at a carrier wavelength of 412 nm. The calculated frequencies are categorized into 3 symmetry groups (A1, B1/B2, and A2/E) and are shown by bars. The calculation predicts frequency shifts for 4 A1 modes and 1 E mode when Cl is exchanged with Br, where each mode is highlighted by a different color (red, blue, green, purple, and light blue). Correspondences between the Raman bands, FCS bands, and DFT frequencies are displayed by dotted lines. (C) Open-band coherence oscillation data, LPSVD fits (left) and LPSVD power spectra (right) of Fe(P)(Cl) and Fe(P)(Br). The frequency shifts between the two samples are displayed by dotted lines.

