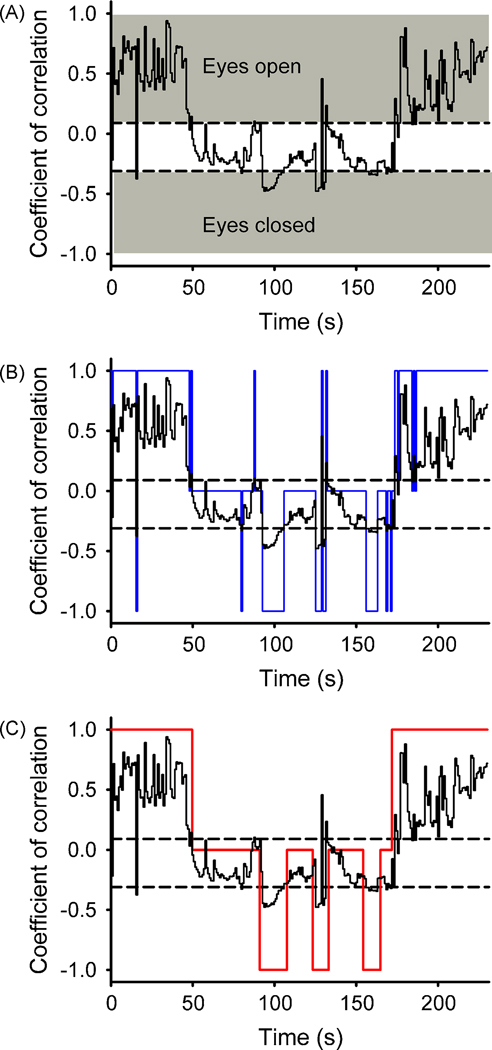
Figure 3.
Analysis of coefficients of correlation (R), calculated between the two distributions of pixel brightness values for the stained and unstained eyelids. A. Raw coefficient of correlation values calculated from a 230-second segment of data. Two thresholds were defined by the user (dashed lines) to determine ranges of R-values that corresponded to open or closed eye lids (grey). B. Translation of R-values into state values (blue curve), i.e., 1 (eyes open), 0, (intermediate) or −1 (eyes closed). C. Smoothing of the series of state values (see Methods) to exclude episodes of transient eye closure or opening.

