
Figure 2.
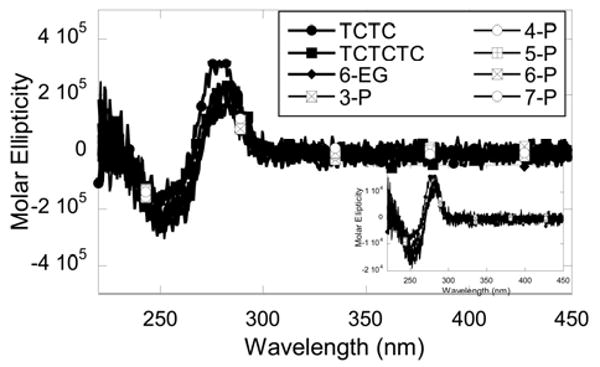
CD spectra of eight DNA hairpins with different loops normalized to hairpin concentrations. No significant difference in CD profiles was observed among different hairpins. The spectra were collected with 1 μM hairpin in MES buffer containing 92 mM NaCl at 25 °C. The inset the shows the same spectra with the molar ellipticity normalized to base concentrations.