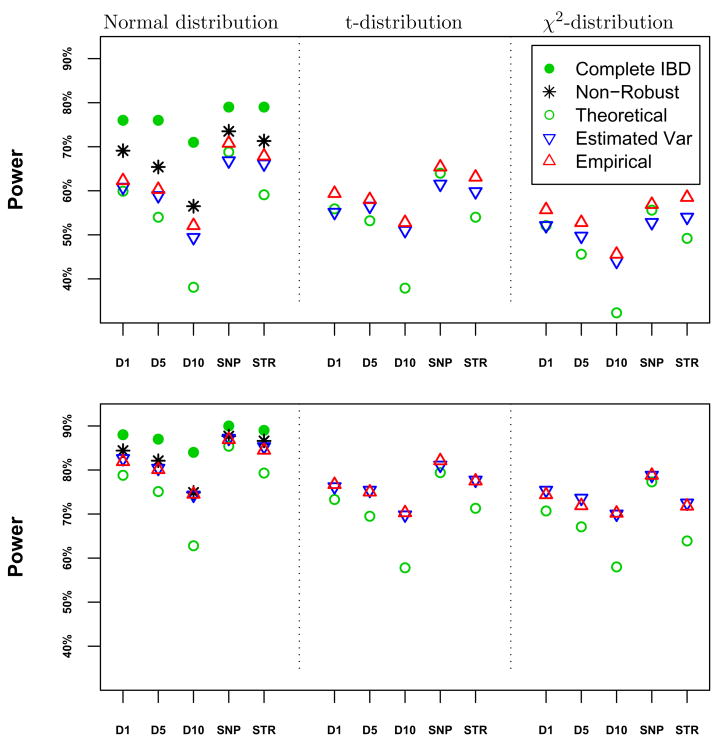
Figure 3.
Power for (top) 200 three-generation pedigrees; and (bottom) 330 families similar in size to FHS. The leftmost panel are normally distributed trait values, center are t-distributed and rightmost are χ2 distributed trait values. D1: 151 SNPs every 1 cM; D5: 31 STRs every 5 cM; D10: 16 STRs every 10 cM; SNP: 190 SNPs ~ 0.6cM; and STR: 18 STRs ~ 5.8cM.

