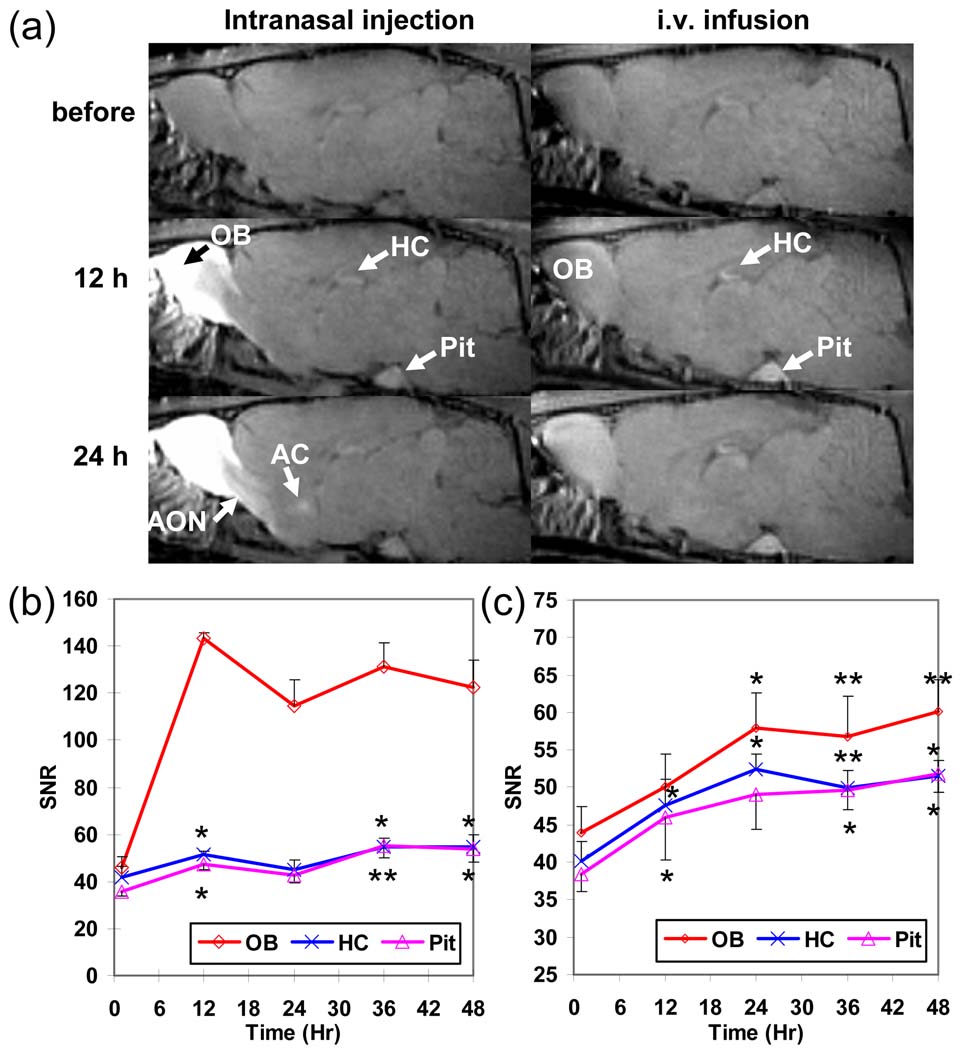
Fig 1.
(a) Time series T1-weighted images of rat brains before and at 12 and 24 h after intranasal MnCl2 injection (left column) and i.v. infusion of 9mg/kg of MnCl2 (right column). The averaged SNR time courses of the OB, HC, and Pit at 1, 12, 24, 36, and 48 h after (b) intranasal injection and (c) i.v. infusion of 9 mg/kg of MnCl2 (the error bar represents the standard error among animals). Significant early enhancement in HC and Pit indicates that the contrasts are due to systemic effects rather than tract tracing. (*: p < 0.05; **: p < 0.01, paired t-test compared to the first time point.)

