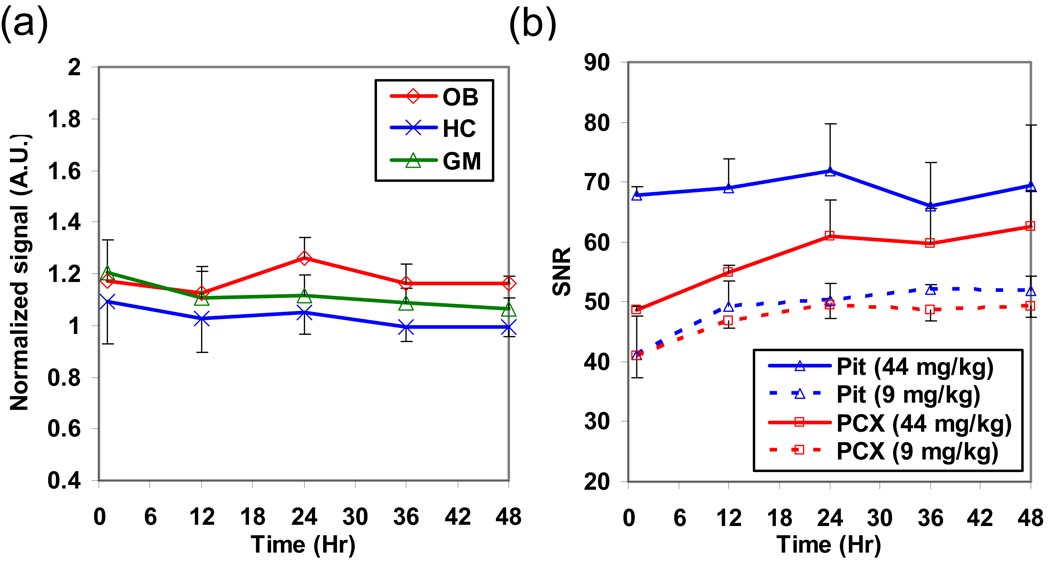
Fig. 2.
(a) The normalized signal time courses in the OB, HC, and GM by the Pit signal in rats with i.v. infusion of 9 mg/kg of MnCl2 (N = 5; the error bar represents the standard error among animals). After the normalization, these tissues didn’t have significant signal change at all the time points. (b) The SNR time courses in the Pit and PCX with i.v. infusion of 44 mg/kg (N = 3; solid lines) and 9 mg/kg (N = 5; dashed lines) of MnCl2. At the high dose condition, the signal plateau in the Pit from 1h suggested that its capacity of absorbing Mn2+ may be saturated.

