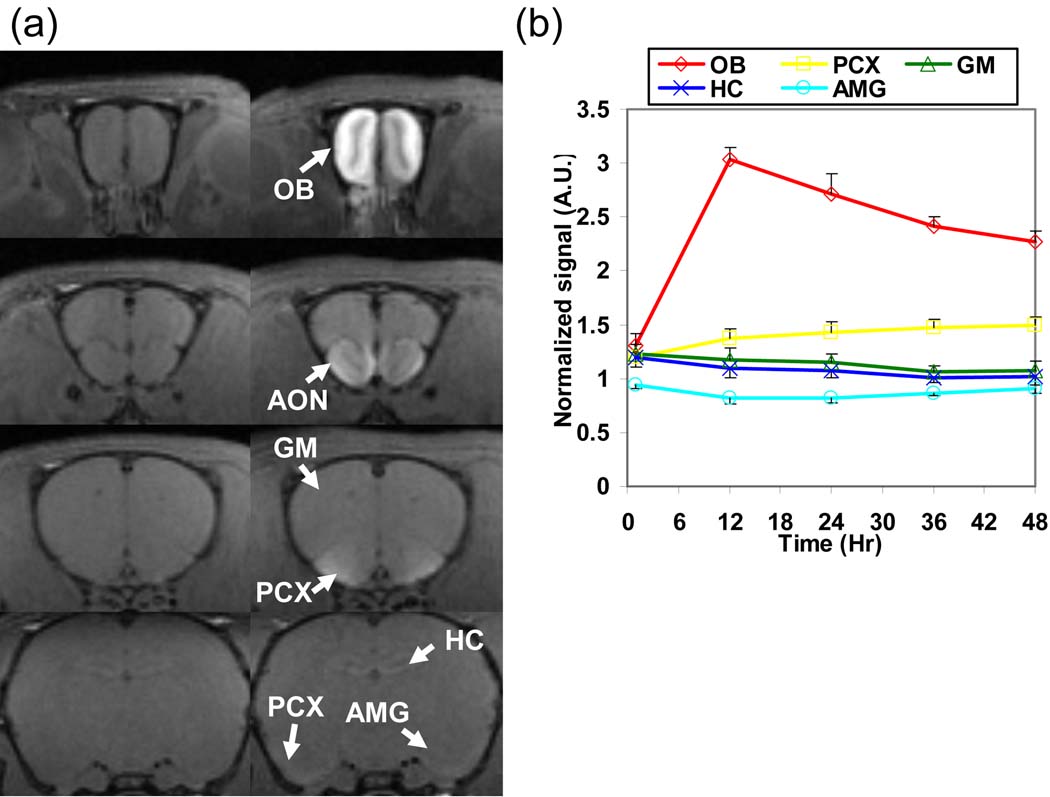
Fig 3.
(a) T1-weighted images of a rat after intensity normalization by the Pit signal before (left column) and at 24 h (right column) after intranasal MnCl2 injection. After normalization, significant contrast could still be seen in the OB, AON, PCX, and AC but not in the AMG and HC. (b) The averaged signal time courses (N = 5; the error bar represents the standard error among animals) of the OB, PCX, GM, HC, and AMG after normalized by the Pit signal show that only OB and PCX are enhanced.

