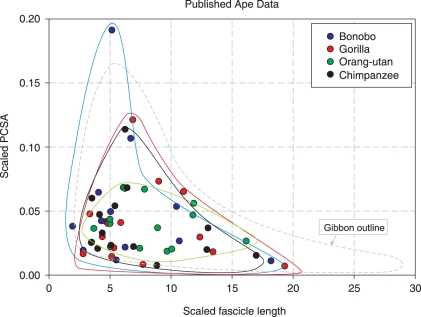
Fig. 9.
Relative physiological cross-sectional area (PCSA) against relative fascicle length for all non-human ape species (see text for scaling parameters). Data for chimpanzee are from Thorpe et al. (1999), data from bonobo, gorilla and orang-utan are from Payne et al. (2006a).The coloured shapes visualize the position of the muscles of each species. Blue, bonobos; grey dotted, gibbon; red, gorilla; black, common chimpanzee; green, orang-utan.

