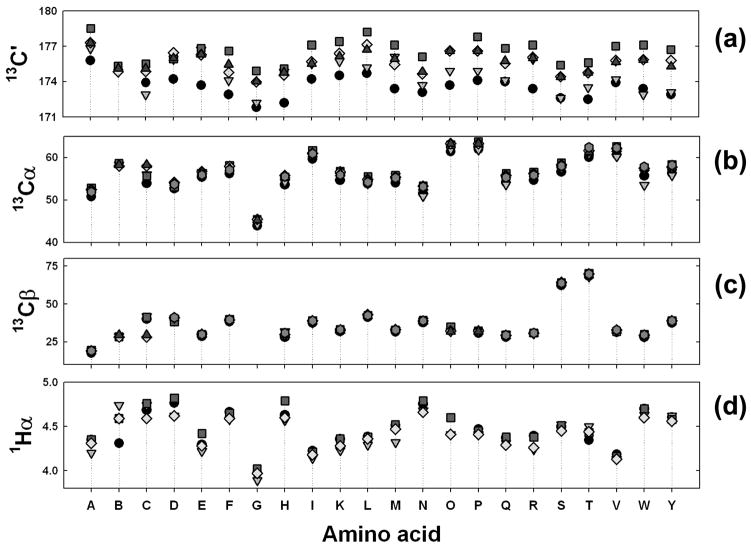
Figure 5.
Plots of the variation in the reference random coil values as a function of amino acid type. Panels (a), (b), (c) and (d) correspond to random coil values of 13C′ (carbonyl carbon), 13Cα, 13Cβ and 1Hα, respectively. The six different reference value sets are represented by symbols: black circles (KW) [21], [76], grey triangles (WS) [77], [199], black squares (SD) [74], [90], grey diamonds (LH) [75], black triangles (WJ) and grey circles (WM) [59], [80]. Plots (b) and (c) have all the six sets and plots (a) and (b) have only 5 and 4 sets, respectively (Table 5). Amino acids along the X-axis are given in single letter codes, with ‘B’ and ‘O’ representing oxidized cystine and cis-proline, respectively.

