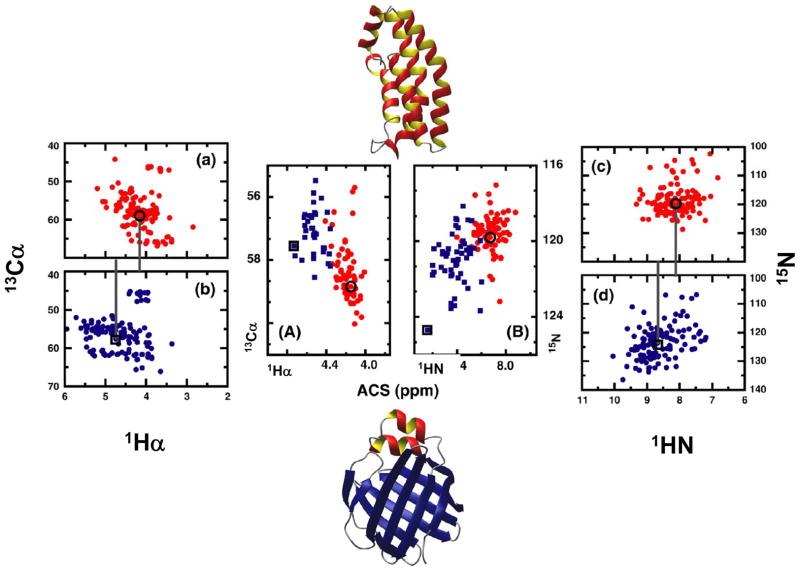
Figure 6.
Representative examples to show that averaged chemical shift (ACS) is a structural parameter directly obtainable from NMR spectra. (a) and (c): simulated 13C and 15N-HSQC spectra of an α-helical protein (Histidine kinase, PDB code 1A0B, BMRB number 4857), respectively. (b) and (d): simulated 13C and 15N-HSQC spectra of a β-sheet protein (Liver fatty acid binding protein, PDB code 1LFO, BMRB number 4098). The ACS calculated from each spectrum is noted by a black circle (helical protein) and square (sheet protein). (A) and (B): representative examples of the ACS values calculated from 13Cα-1Hα and 15N-1HN correlations, respectively, for a set of proteins for which chemical shift information is obtained from BioMagResBank. The red circles and blue squares correspond to proteins that are classified as mainly-α and mainly–β, respectively, under the CATH classification scheme. ACS values from (a) and (b), and (c) and (d), are reproduced in (A) and (B), respectively. Reproduced with permission from Ref. [149].

