Fig. 2.

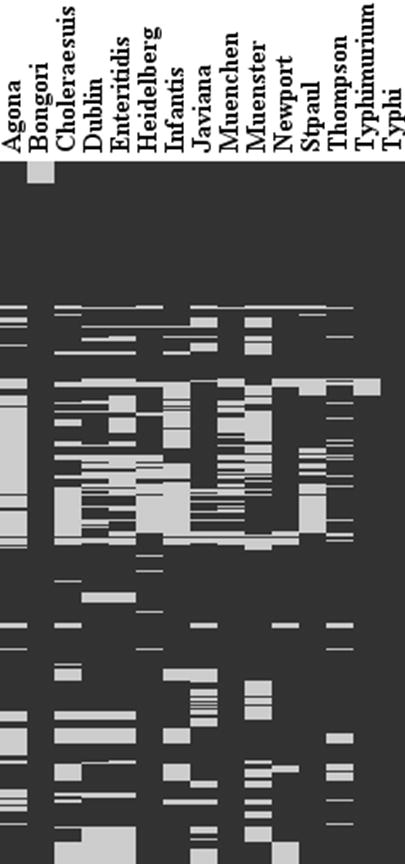
Heat map of the identified gene presence/absence signature by the array. Black regions represent regions that are present. Grey represent the regions that are absent in each serovar.

Heat map of the identified gene presence/absence signature by the array. Black regions represent regions that are present. Grey represent the regions that are absent in each serovar.