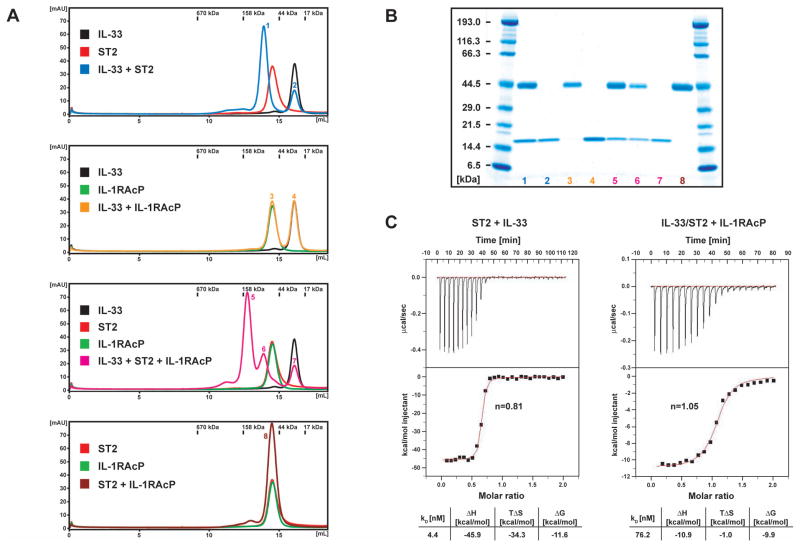
Figure 2. Binding of IL-33 to ST2 and IL-1RAcP.
(A) Size exclusion chromatography analysis
Left: Individual proteins were mixed and analyzed on a Superdex 200 10/300 GL column. The color of the individual traces matches the labeled boxes and numbers on peaks in the profiles correspond to lanes in the gel shown in (B). Protein molecular weights of a gel filtration standard are indicated above the chromatograms.
(B) SDS-Page of the individual peaks of the size exclusion chromatography analysis shown in (A).
(C) ITC binding curves. ST2 was titrated with IL-33 (left) and the IL-33/ST2 complex was titrated with IL-1RAcP (right). The binding curves were fit with a 1:1 binding model, resulting in the deduced stoichiometry n and the thermodynamic parameters listed in the table.

