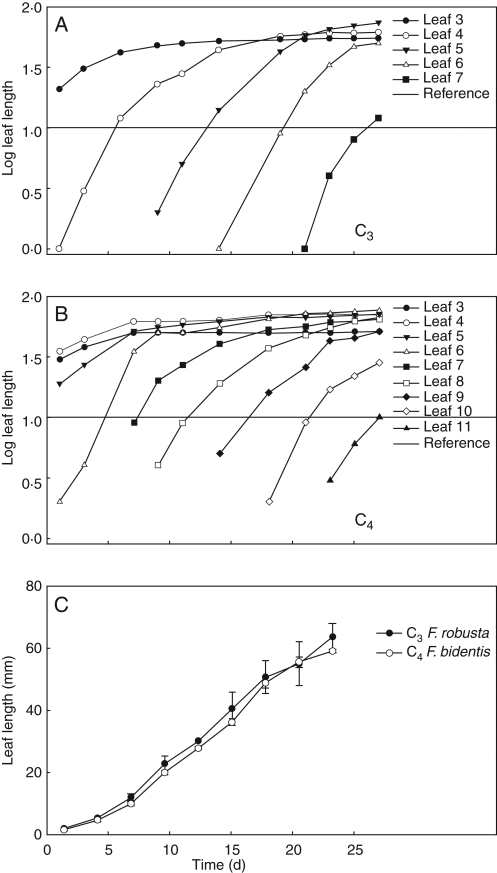
Fig. 2.
Leaf growth curves showing adult-phase leaf length change over time for representative growth chamber grown C3 and C4 Flaveria species. (A) C3 F. robusta. (B) C4 F. bidentis. (C) Growth of adult-phase leaf 5 in C3 and C4 Flaveria. Horizontal lines in (A) and (B) indicate the reference length for leaf plastochron index.

