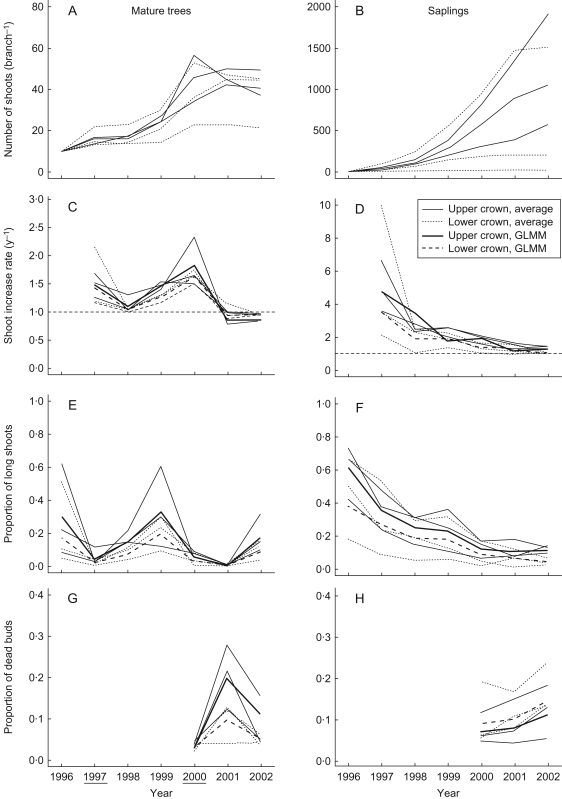
Fig. 2.
Shoot demography in mature trees (A, C, E, G) and saplings (B, D, F, H) in years 1996–2002: (A, B) number of shoots; (C, D) shoot increase rate; (E, F) proportion of long shoots to all shoots; and (G, H) proportion of dead buds to all buds of branches. Each thin continuous and dotted line represents the average value of the branches in the upper and lower crowns of each tree, respectively. Continuous thick and dashed lines show the estimated values by GLMM for the upper and lower branch, respectively. Years underlined were mast years. Because the lower branch of one sapling contained only three shoots that had elongated in 1996, the number of shoots was multiplied by 10/3 for comparison with other branches.

