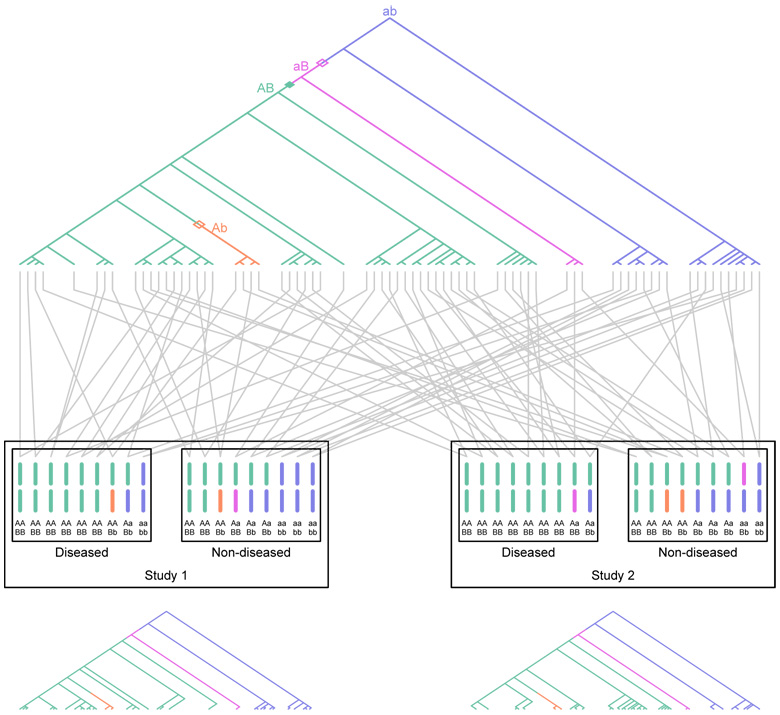
Figure 1.
Schematic of two association studies performed in the same diploid population. Two loci are considered, a disease-susceptibility locus with alleles A and a, and a marker locus with alleles B and b. The genealogy of sampled copies of the susceptibility locus in two association studies is shown. The most recent common ancestor of the sampled copies has haplotype ab. Open diamonds represent recombinations, the closed diamond represents a mutation, and distinct colors represent distinct two-locus haplotypes. The A allele is a true disease-susceptibility allele; allele B is indirectly associated as it lies on the haplotype on which the first A mutation occurred. Gray lines represent the pairing of haplotypes to form diploid individuals. For the purpose of illustration with a small sample size as shown in the figure, disease status is assigned to individuals according to a multiplicative model with penetrance 1/6 for low-risk aa homozygotes and relative risk 2 for heterozygotes. The figure shows that both association studies performed in the population reflect disease associations with allele B.The genealogies at the bottom represent the subgenealogies for the individuals included in the two separate studies. They display a high degree of correlation in the history of events responsible for indirect associations between B and disease.

