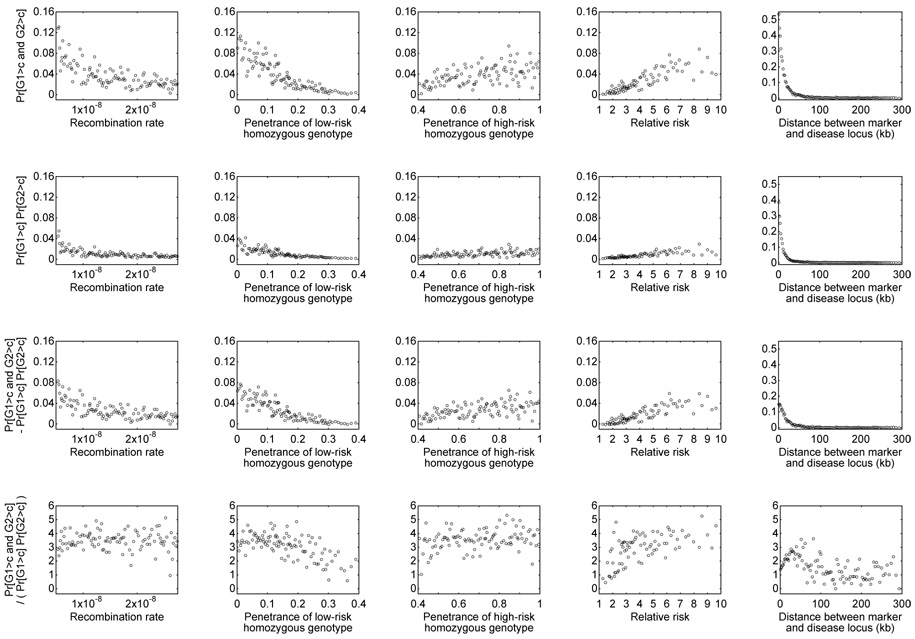
Figure 4.
Pr[G1 > c and G2 > c], Pr[G1 > c] Pr[G2 > c], Pr[G1 > c and G2 > c] − Pr[G1 > c] Pr[G2 > c], and Pr[G1 > c and G2 > c]/(Pr[G1 > c] Pr[G2 > c]) as functions of recombination rate (r), penetrance of the low-risk homozygous genotype (pL), penetrance of the high-risk homozygous genotype (pH), relative risk (pH/pL), and distance between the marker and the disease locus. For each of these variables, the 100,000 simulated pairs of studies were binned into 100 groups each consisting of 1000 pairs. The quantities evaluated from the studies in a bin are plotted at the mean of the 1000 values placed in the bin. The plots are based on demographic Model 2 with the recessive disease model.

