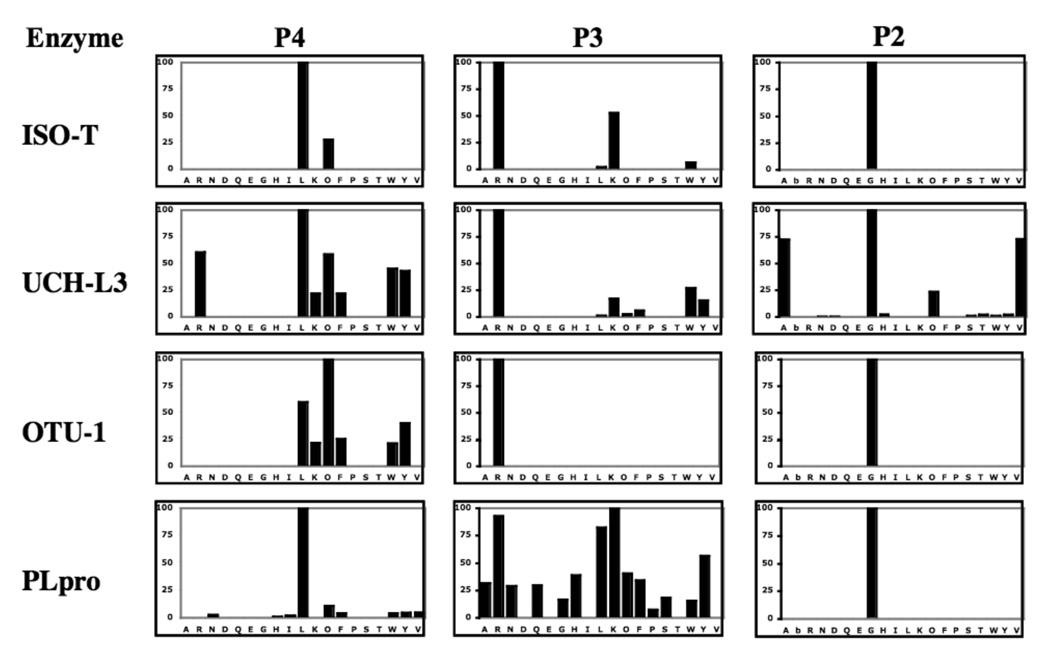
Figure 2. Subsite preferences of DUBs – IsoT, UCH-L3, OTU-1 and PLpro.
The enzyme concentration was in the range 1–5 µM. ACC production was monitored using an fmax multi-well fluorescence plate reader (Molecular Devices) at excitation wavelength of 355 nm and an emission wavelength of 460 nm. Assay time 15–30 min. The x-axis represents the one letter code of natural amino acids (O - nor-leucine, bA-beta-alanine). The y-axis represents the average relative activity expressed as a percent of the best amino acid.

