
Fig. 6.
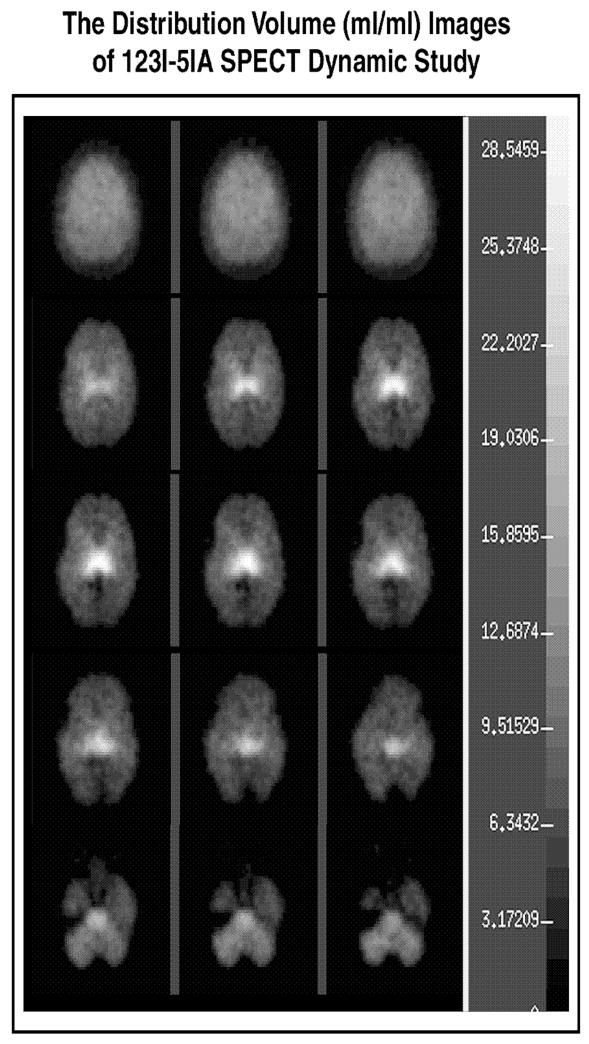
Parametric single photon emission computed tomography (SPECT) images of the high-affinity α4β2* neuronal nicotinic acetylcholine receptors (nAChRs) in the cerebral cortex, the thalamus, the temporal lobes, and the cerebellum on a transverse sections through the brain at three time points (columns) after the intravenous bolus administration of 8.1 mCi (S)-5-[123I]iodo-3-(2-azetidinylmethoxy)pyridine (5-[123I]IA) to a healthy 35-year-old male nonsmoker (Subject 1). The superior part of the brain is on top of the image. The right side of the brain is illustrated on the left side of the image.