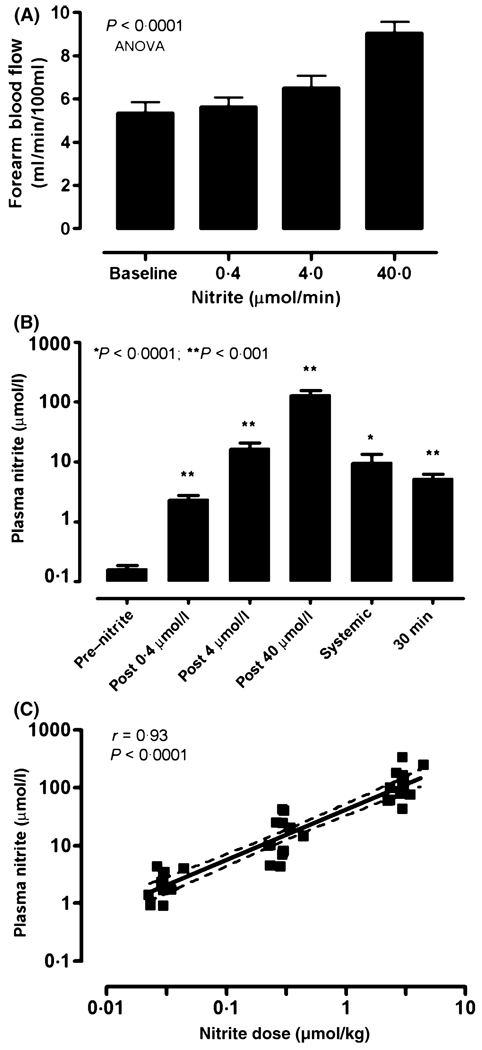
Fig 2.
Sodium nitrite infusions increase regional blood flow and venous plasma nitrite levels as a function of nitrite dosing. (A) Sodium nitrite infusions into the brachial artery of patients with SCD increases forearm blood flow in a dose-dependent manner (P < 0·0001). Values represent means ± SEM. (B) Mean venous plasma concentrations increase from baseline in a dose-dependent manner. The systemic mean venous plasma nitrite concentration is from the contralateral arm 5 min after maximal nitrite infusion. The last bar represents the mean venous plasma nitrite concentration 30 min after the maximal nitrite infusion dose. Bars represent mean ± SEM. *P < 0·05; **P < 0·001, paired t-test compared to baseline. (C) Sodium nitrite dosing controlled for weight and expressed as µmol/kg, correlates positively with the corresponding venous plasma nitrite concentration sampled from the ipsilateral vein after arterial infusions (Spearman r = 0·93, P < 0·0001). The solid line represents the regression line, and the dashed lines the 95% confidence limits.

