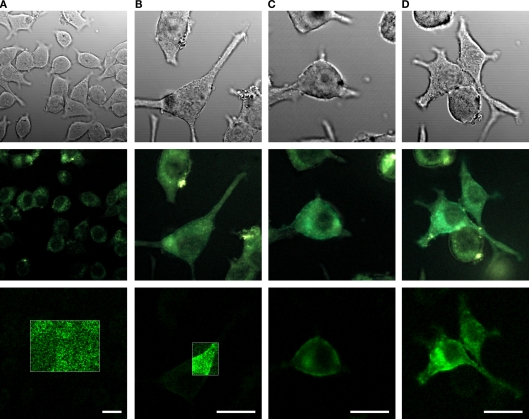
Figure 2.
Comparison of the expression levels of cpEGFP-based VSFP variants in PC12 cells. Images of PC12 cells transfected with either VSFP(A)cpEGFP (A), VSFP(B)cpEGFP (B), VSFP(C)cpEGFP (C) or VSFP(D)cpEGFP (D). The first row illustrates the differential interference contrast images of PC12 cells. Second row, identical field of view, shows the real color fluorescence images of PC12 cells. The third row illustrates the GFP component of the fluorescence shown in the second row after linear spectral deconvolution of the real color images. The fluorescence intensity within the white box is represented with 10-fold larger scale. The cells were excited with a 444-nm wavelength diode laser. Scale bars = 20 μm.

