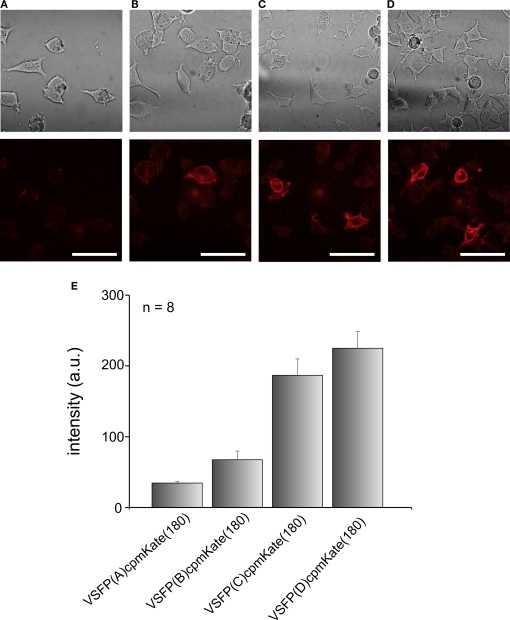
Figure 5.
Comparison of the expression levels of VSFP variants derived from cpmKate(180) in PC12 cells. Differential interference contrast (upper row) and real color confocal fluorescence (lower row) images of PC12 cells expressing either VSFP(A)cpmKate(180) (A), VSFP(B)cpmKate(180) (B), VSFP(C)cpmKate(180) (C) or VSFP(D)cpmKate(180) (D). Note the targeting to the plasma membrane. (E) Comparison of the fluorescence intensity of cpmKate(180)-based VSFP variants. n = 8, number of cells used for each variant. Imaging was carried out using a 543-nm wavelength He–Ne laser. Scale bars = 50 μm.

