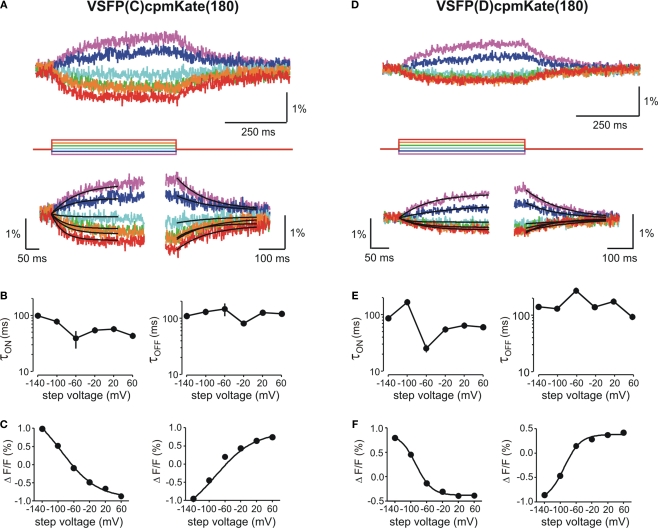
Figure 6.
Functional characterization of cpmKate(180)-based VSFP variants in voltage-clamped PC12 cells. Changes in red fluorescence (upper traces) evoked by a family of voltage steps from a holding potential of −70 mV to test potentials ranging from −140 to 60 mV in 40 mV increments recorded from PC12 cells expressing VSFP(C)cpmKate(180) (A) or VSFP(D)cpmKate(180) (D). Lower panels show the single exponential fits of the ON (left) and OFF (right) time components of the fluorescence signal in response to each command potential. (B,E) Voltage dependence for the time constants of the ON (left) and OFF (right) responses. Note the slightly faster response of VSFP(C)cpmKate(180) as compared to VSFP(D)cpmKate(180). (C,F) Normalized fluorescence change versus step voltage during ON (left) and OFF (right) time responses. Lines are Boltzmann fits. Data are mean values obtained from five and six cells and 10–20 repetitions per cell for VSFP(C)cpmKate(180) and VSFP(D)cpmKate(180), respectively.

