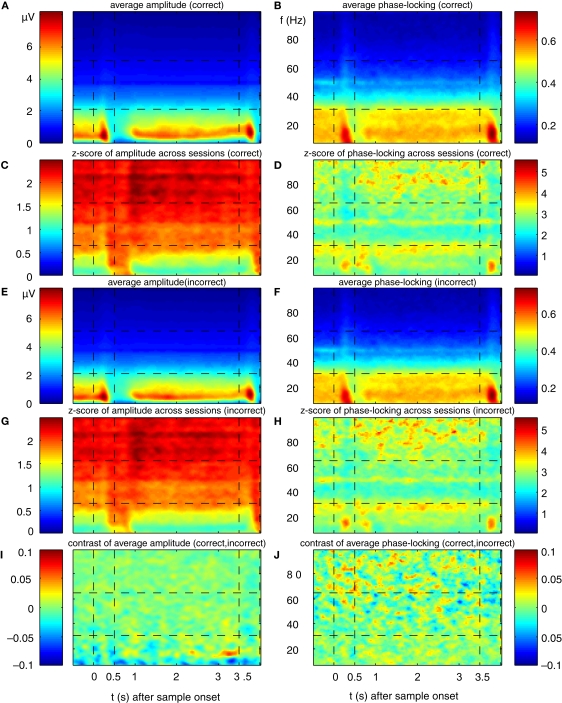
Figure 3.
Grand-average power and phase-locking of prefrontal LFPs. (A,E) Grand average power for trials with correct and incorrect responses, respectively of all simultaneously recorded signals from two monkeys recorded in 12 sessions with a total of 4124 trials, from 146 sites and 921 pairs. (C,G) Z-score for grand average power is plotted in relation to variance (SEM) across experiments for trials with correct and incorrect responses, respectively. (B,F) Grand average phase-locking plotted for trials with correct and false responses, respectively. (D,H) Z-score for grand average phase-locking in relation to variance (SEM) across experiments for trials with correct and incorrect responses, respectively. (I,J) Contrast of grand average power [(A − E)/(A + E)] and phase-locking [(B − F)/(B + F)] plotted as TF map. The maximum contrast of c = 0.08 indicates a relative difference between trials with correct and false responses of 0.5%.

