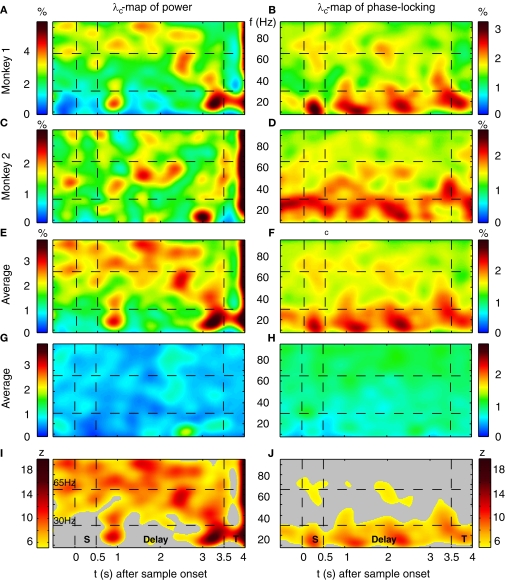
Figure 4.
Performance-dependent increases of β- and γ-oscillations and their phase-locking in prefrontal field potentials. (A–F) Time-frequency λc-maps for individual monkeys (A–D) and as average across subjects (E,F) provide the percentage of sites/pairs with significant increases of power/phase-locking in trials with correct responses, based on 12 sessions, 4124 trials, 152 sites and 921 pairs of sites. Abscissa and ordinate represent peri-stimulus time aligned to the onset of sample stimuli and signal frequency, respectively. Color-codes provide the percentage of sites/pairs with significant changes (‘S’, ‘T’: Sample and Test stimulus presentation, ‘Delay’: during delay the information of the sample has to be maintained). The left column provides maps for power and the right column maps for phase-locking. (G,H) shows the same as (E,F), but for scrambled (λchance) trials to destroy any existing performance effect. Hence, λchance-maps show the amount of modulation of λc and of λi for power in (G) and for phase-locking in (H) that can be expected purely by chance. (I,J) The same modulation of λc-maps as shown in (E,F), but expressed as a z-score in relation to the mean and standard deviation of purely random modulation of the λchance-maps shown in (G,H) . The critical z-score (zcrit = 4.19) for a two sided modulation and a test level 1% has been Bonferroni corrected for 24 non-overlapping sliding windows during pre-sample, sample, delay, and test and 16 non-overlapping frequency bands between 7 and 95 Hz.

