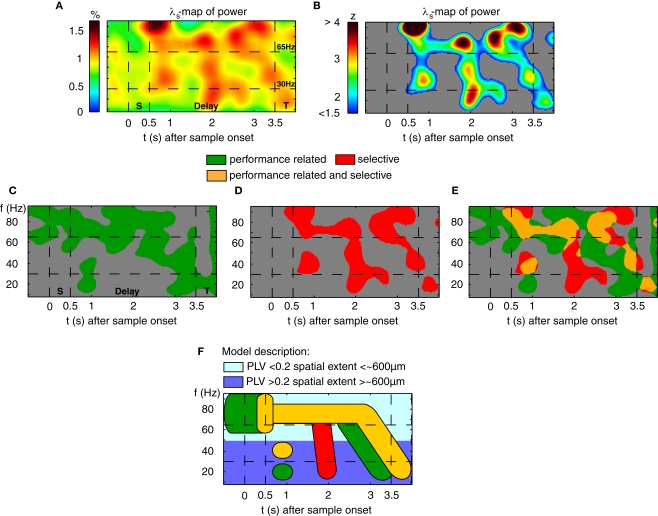
Figure 5.
Stimulus-selective and performance-dependent increases of ß- and γ-oscillations in prefrontal field potentials. (A) Time-frequency λs-map averaged across data from two monkeys (7 Sessions, 4040 Trials, and 94 Sites). Abscissa and ordinate represent peri-stimulus time aligned to the onset of sample stimuli and signal frequency, respectively. Color codes provide the percentage of sites with significant differences in power across different stimuli (‘S’, ‘T’: Sample and Test stimulus presentation). (B) Modulations of the λs(P)-map expressed as z-score in respect to baseline (−0.5–0 s). (C) Performance-related (λc-maps, green) and (D) stimulus-selective (λs-maps, red). The threshold used in (C–E) reflects 30% of the modulation between chance level and maximum λs during delay. (E) Direct comparison of performance-related (green) and stimulus-selective (red) modulation in power. Zones marked in orange represent periods during which significant increases of both performance and stimulus-related oscillations are present in the same frequency range. (F) Model description of time-frequency zones with: (1) performance-related increase in power (green), (2) object-selective power increase (red) and (3) overlapping zones that exhibit both effects (orange). Light blue indicates grand average PL lower than 0.2, reflecting oscillatory processes confined to the average spacing between two electrodes. In contrast, dark blue indicates PL higher than 0.2, which is compatible with spatially more extended processes that span average distances of ∼600 μm.

