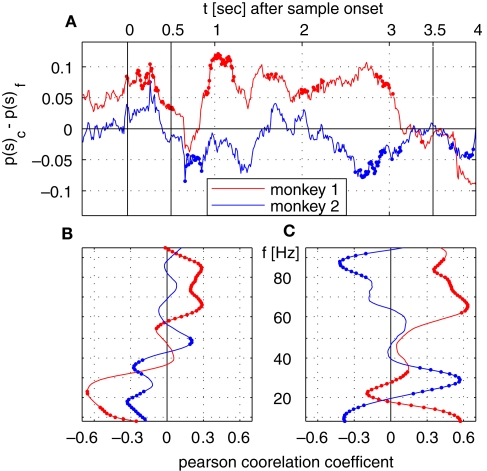
Figure 6.
Time course of saccade probability and correlation analysis with time course of λc. (A) Difference in saccade probability in trials with correct and incorrect behavioral responses per sliding window for monkey 1 (red) and 2 (blue). Dotted segments identify periods which are significantly different (1% level) from zero. (B,C) Pearson correlation coefficients for monkey 1 (red) and monkey 2 (blue) for time course of saccade probability difference of saccades per sliding window displayed in (A) and the percentage of sites with increased power (B) or pairs of sites with increased phase-locking (C) for trials with correct behavioral responses.

