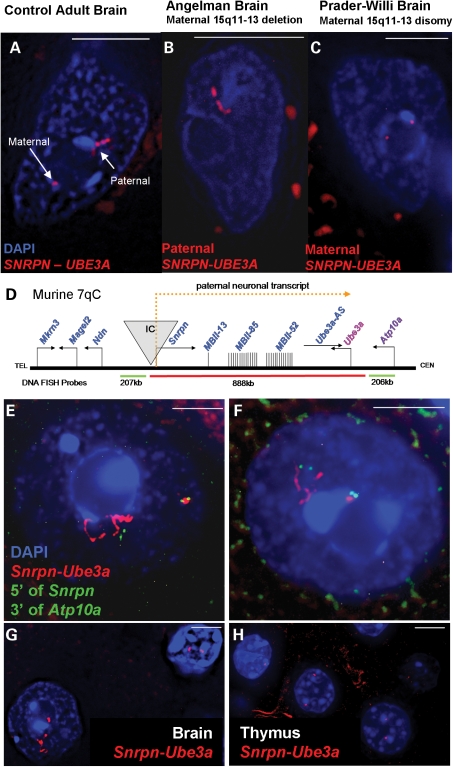
Figure 1.
DNA FISH using a probe contig spanning SNRPN–UBE3A (red fluorescence) on post-mortem human and mouse brain samples reveals two distinct parental chromatin structures in neuronal nuclei, counterstained with DAPI (blue fluorescence). White bar represents 5 µm. (A) Representative control adult neuronal nucleus containing a small maternal SNRPN–UBE3A signal and an extended paternal SNRPN–UBE3A signal. (B) Representative Angelman (maternal 15q11–q13 deletion) neuronal nucleus containing a single extended paternal SNRPN–UBE3A signal. (C) Representative Prader–Willi (maternal disomy) neuronal nucleus with two small maternal SNRPN–UBE3A signals. (D) Neuron-specificity and locus boundaries of chromatin decondensation for murine 7qC (syntenic to human 15q11–q13). A diagram of the Snrpn–Ube3a locus showing paternally expressed genes in blue, maternally expressed genes in red, components of the paternal neuronal transcript in yellow and the imprinting center (IC) in grey. DNA FISH probes are diagramed below and colored to match probe fluorescence. Not drawn to scale. (E and F) Representative images of the Snrpn–Ube3a signals seen in mouse adult neuronal nuclei throughout the brain. Red fluorescence shows a decondensed Snrpn–Ube3a paternal signal and a small compact Snrpn–Ube3a maternal signal corresponding to the transcriptional activity of the alleles. The small green signals are the combined flanking probes 5′ of Snrpn and 3′ of Atp10a. While signal length was variable between individual nuclei, paternal signals averaged ∼4 µm and maternal signals averaged ∼0.5 µm in Purkinje, hindbrain and cortical neurons in adult murine brain (Supplementary Material, Fig. S3). Distances between the flanking probes on each Snrpn–Ube3a allele were utilized to determine the percentage of paternal signals which loop back on to the chromosomal backbone by using the average distance between the flanking probes on the maternal allele plus one standard deviation (1.13 µm + 0.58 = 1.71 µm) as a threshold for looping for the paternal allele. Over 43% of the paternal Snrpn–Ube3a alleles looped back to the IC by this definition as shown by these representative nuclei. (G) Paternally extended Snprn–Ube3a signals are neuron-specific as can be seen in this representative image in which the adult neuronal nucleus shows the decondensed allele (bottom left), whereas only two small signals are seen in the glial nucleus (upper right). (H) No decondensed signals were seen in any other adult tissue (thymus, kidney, spleen, liver), thymus nuclei shown.

