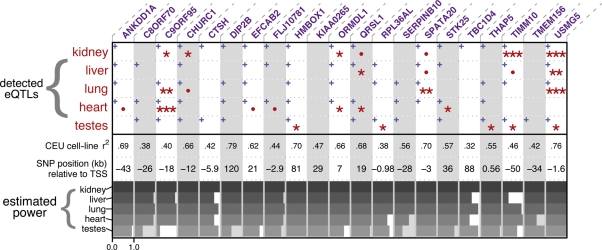
Figure 2.
Summary of detected eQTLs and our predicted power. Columns correspond to the 21 genes we tested for eQTLs. One-sided P-values from linear models testing the eQTL are summarized by either one (0.05 > P > 0.01), two (0.01 > P > 0.001), or three (0.001 > p) red asterisks; marginally significant tests (0.1 > P > 0.05) are marked with a red dot (see Supplementary Material, Table S1 for all P-values). Blue plus signs indicate the effect is in the same direction as the effect observed in the LCLs. CEU cell-line r2 is the proportion of variance explained by genotype in a linear model fit to the original CEU cell-line data. Estimated power is illustrated with horizontal gray bars for each eQTL-tissue combination using microarray expression data sampled from CEU HapMap LCLs with matching genotypes (see Materials and Methods), with the axis (ranging from 0 to 1) shown below only for the first column.

