Figure 4.
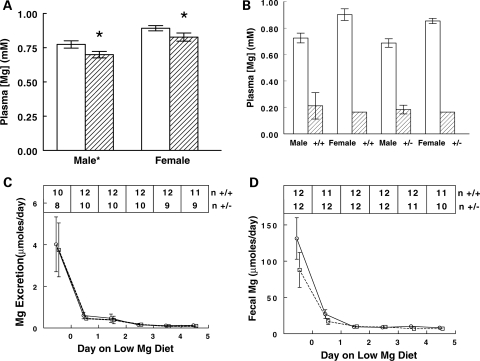
Plasma [Mg] and response to low Mg diet in Trpm6+/+, and Trpm6+/−, mice. (A) Plasma [Mg] by genotype and gender on a normal diet. Open bars, Trpm6+/+; hatched bars, Trpm6+/−. Both gender and genotype were significantly different by two ways ANOVA; there was no interaction. Nine to 14 mice in each group. *P < 0.05 compared with Trpm6+/+. (B–D) Response to 5 days of a low Mg diet. (B) Plasma [Mg] before (open bars, n = 4,6) and after (hatched bars, n = 4,5) low Mg diet. (C) Urinary Mg excretion in Trpm6+/+ (circles) and Trpm6+/− (squares) mice during the low Mg diet. There was no difference in plasma [Mg] after the low Mg diet by genotype or gender. There was no difference in fecal or urinary excretory response to low Mg diet by genotype or gender at any day.

