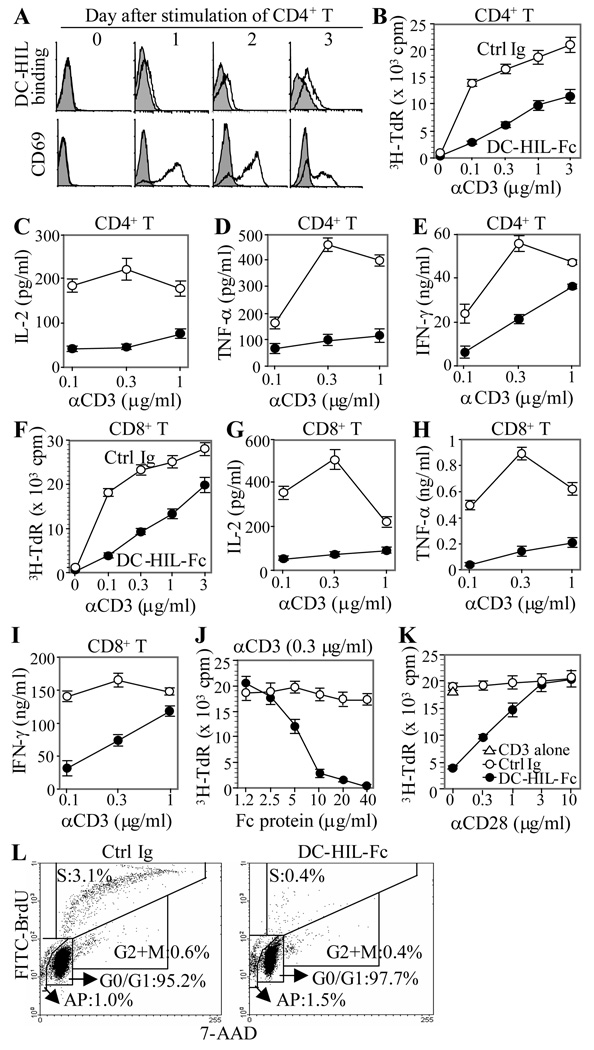
Figure 1. Binding of DC-HIL to activated T cells leads to attenuated anti-CD3 response.
(A) At different time points after stimulation with PMA/ionomycin, CD4+ T cells were harvested and incubated with DC-HIL-Fc (open histograms) or control Ig (filled in gray) and PE-anti-mouse IgG Ab. Activated CD4+ T cells were also immunostained with anti-CD69 mAb or control IgG. Binding of DC-HIL-Fc and expression of CD69 were examined by flow cytometry. (B through I) Purified CD4+ (B through E) or CD8+ T cells (F through I) were cultured in 96-well plates (in triplicate) pre-coated with DC-HIL-Fc (closed circles) or control (Ctrl) Ig (open circles) (each 10 ìg/ml) plus anti-CD3 Ab at increasing doses. After culturing for 2 d, T cell proliferation was measured by 3H-thymidine (TdR) incorporation (B and F) or production of IL-2 (C and G), TNF-α(D and H), or IFN-γ (E and I) (mean ± SD, n = 3). (J) CD4+ T cell activation triggered by anti-CD3 Ab (0.3 µg/ml) was treated with increasing doses of DC-HIL-Fc or control Ig. (K) Anti-CD3 response (0.3 µg/ml) of T cells treated with DC-HIL-Fc or control Ig (5 µg/ml) was cultured with increasing doses of anti-CD28 Ab. T cells treated with anti-CD3 Ab (0.3 µg/ml)/DC-HIL or control Ig (each 5 µìg/ml) were cultured with increasing doses of anti-CD28 Ab. Activation was measured by 3H-thymidine (mean ± SD, n = 3). (L) After culturing with anti-CD3 Ab (0.3 µg/ml) and DC-HIL-Fc or control Ig (5 µg/ml) for 2 d, cells were subjected to cell cycle analysis using BrdU incorporation (FITC-anti-BrdU) and 7-AAD (labeling total DNA). Dot-blot analysis of BrdU/7-AAD staining is shown. All data shown are representative of at least 3 separate experiments.

