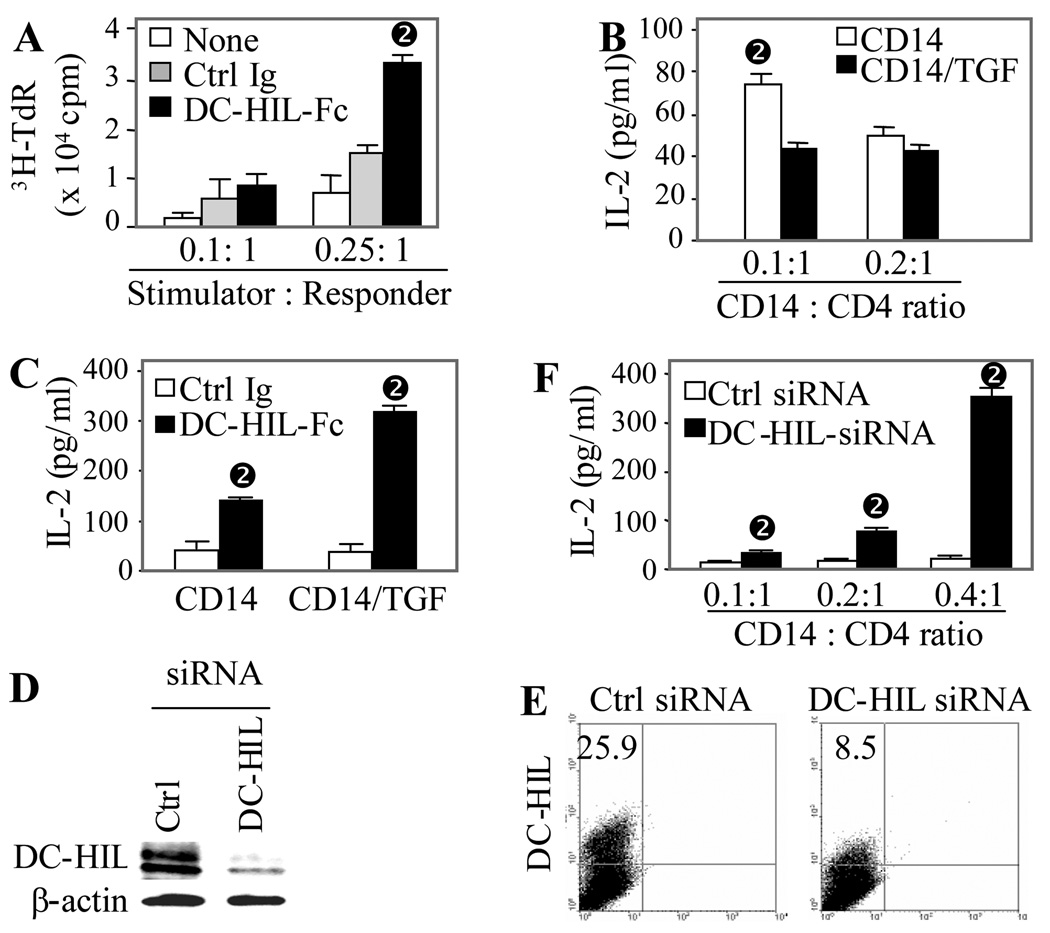
Figure 5. DC-HIL expression correlates inversely with allostimulatory capacity of CD14+ monocytes.
(A) γ-irradiated PBMC (stimulators) were mixed with allogeneic CD4+ T cells (responders) at varying ratios and cultured for 6 d in the absence (None) or presence of DC-HIL-Fc or control Ig. Proliferation was measured by 3H-thymidine incorporation. T cell activation is expressed as cpm after deduction of background cpm (control culture in which γ-irradiated responders and unirradiated stimulators were mixed) from experimental cpm (mean ± SD, n = 3). (B) CD14+ cells were untreated or treated with TGF-β (10 ng/ml) for 2 d and then co-cultured with allogeneic CD4+ T cells at a ratio of 0.1:1 or 0.2:1 (CD14+ cells : CD4+ T cells). T cell activation was assessed by IL-2 production (mean ± SD, n = 3). (C) TGF-â-treated or untreated CD14+ cells were co-cultured with CD4+ T cells at a ratio of 0.2:1 in the presence of DC-HIL-Fc or control Ig (mean ± SD, n = 3). (D and E) CD14+ cells were transfected with DC-HIL-targeted or control siRNA. 2 d post-transfection, protein and surface expression of DC-HIL or β-actin was examined by immunoblotting (D) and flow cytometry (E), respectively.
(F) siRNA-transfected CD 14+ cells were allowed to activate allogeneic CD4+ T cells in co-culture with varying ratios. 6 d after co-culturing, IL-2 production was measured (mean ± SD, n = 3). *p<0.05 vs. values treated with control Ig using Student’s t test.

