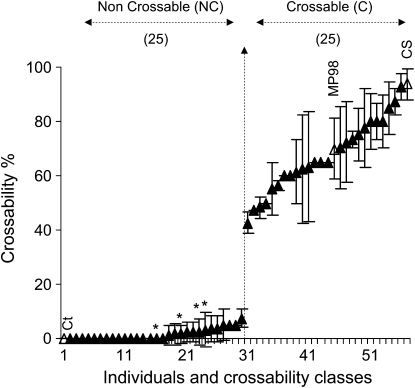
Figure 1.—
Distribution of the crossability (in %) in the 50 recombinant SSD individuals selected at the SKr locus. Standard deviation and confidence intervals were calculated for each individual. The number of plants found in each of the two crossability classes, noncrossable (NC) and crossable (C) is indicated above the graph. The crossability values are illustrated for the reference parental lines Ct (0%), MP98 (70 ± 11.32%), and Chinese Spring (CS, 93.3 ± 5.66%) (open triangles). The four asterisks denote the individuals showing residual heterozygosity at the SKr locus.

