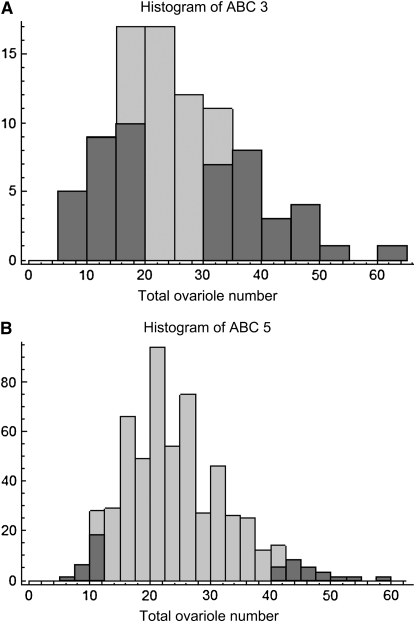
Figure 6.—
(A) Histogram of ABC3 worker total ovariole number used for selective pooled QTL mapping, raised in an unrelated nurse colony; median 23.5, range 5–62; N = 88. Shading indicates samples included in the high and low pools. (B) Histogram of ABC5 worker total ovariole number used for selective pooled QTL mapping, raised in an unrelated nurse colony; median 23.0, range 7–58; N = 571. Shading indicates samples included in the high and low pools.

