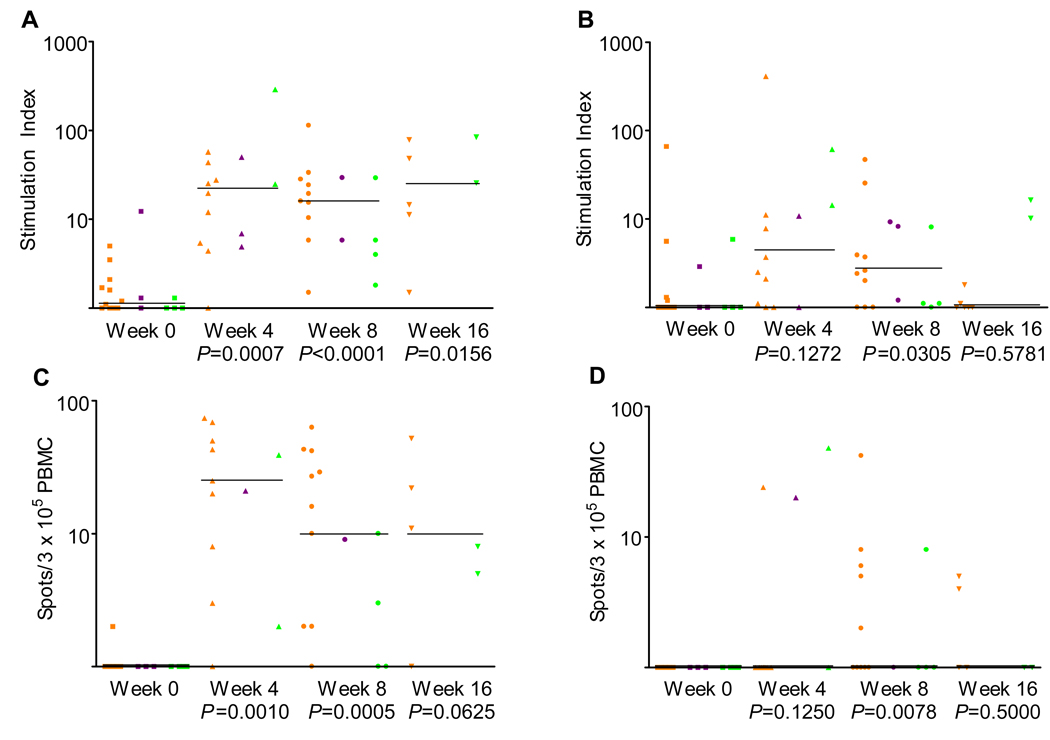
Figure 1.
T cell proliferation data for (A) BA7072 and (B) HER500 at 10 µg/mL. Interferon gamma (IFN-γ;) enzyme-linked immunospot (ELISPOT) data for (C) BA7072 and (D) HER500 at 10 µg/mL. Data are shown for each sample. Median response for each time point is indicated by the line. Orange, purple, and green marks represent breast, colon, and ovarian cancer patients, respectively. P-values associated with the change at each week from baseline were calculated using the Wilcoxon signed rank test.

