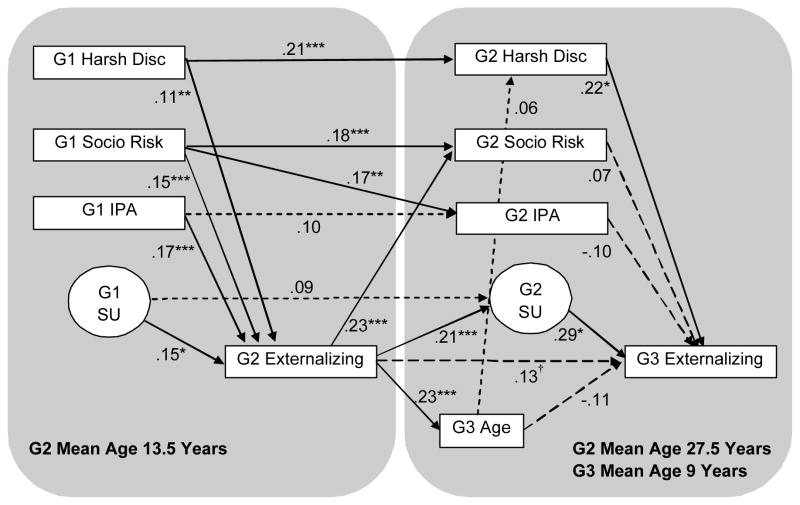
Figure 4.
Final model. Intercorrelations among G1 Substance Use (SU), G1 IPA, G1 Sociodemographic Risk, and G1 Harsh Discipline were specified in the statistical model, but are not shown to improve readability of the figure. Intercorrelations among G2 Substance Use (SU), G2 IPA, G2 Sociodemographic Risk, and G2 Harsh Discipline and between G3 Age and G2 Sociodemographic Risk were specified in the statistical model, but also are not shown. Dashed lines indicate nonsignificant paths. *** p < .001, ** p < .01, * p < .05, †p < .10.

