
Figure 7.
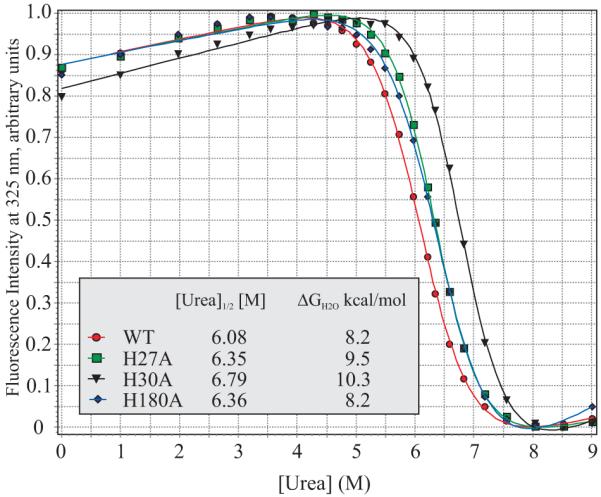
Chemical denaturation curves of WT, H27A, H30A and H180A-hPRL are presented in order to compare their global stabilities. Normalized, intrinsic Trp fluorescence is plotted as a function of urea concentration and the data fitted to theoretical curves, from which are derived the displayed [urea]med and ΔGunf values.